Marin County Real Estate Report |
Median house sales price hits new high; year-over-year total listing inventory down; sales activity way up; luxury home sales soar |
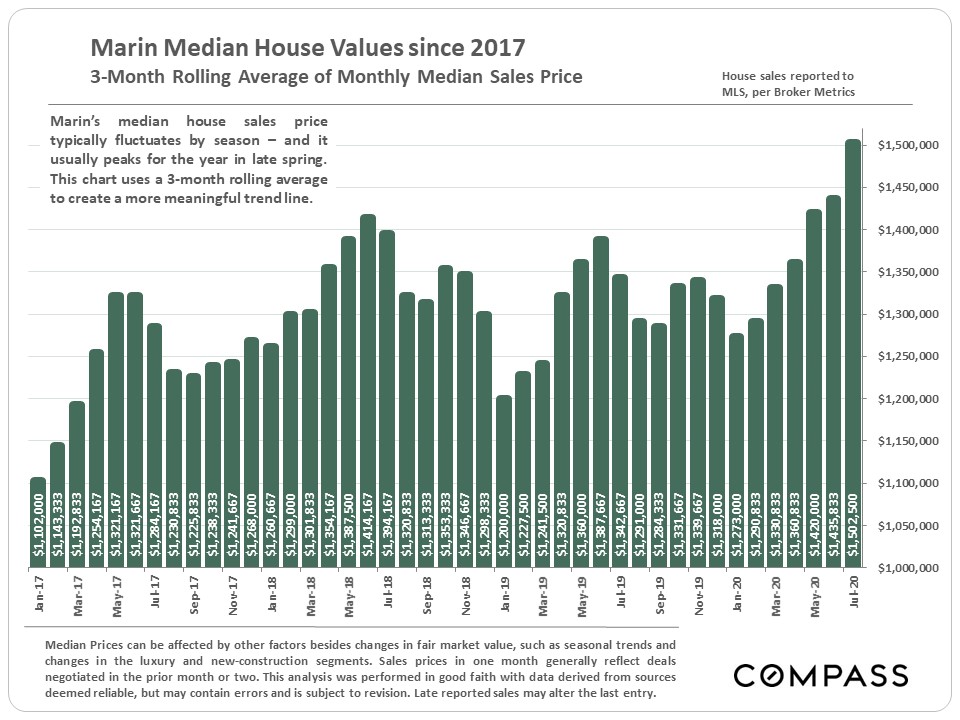
Median House Sales Price Trend |
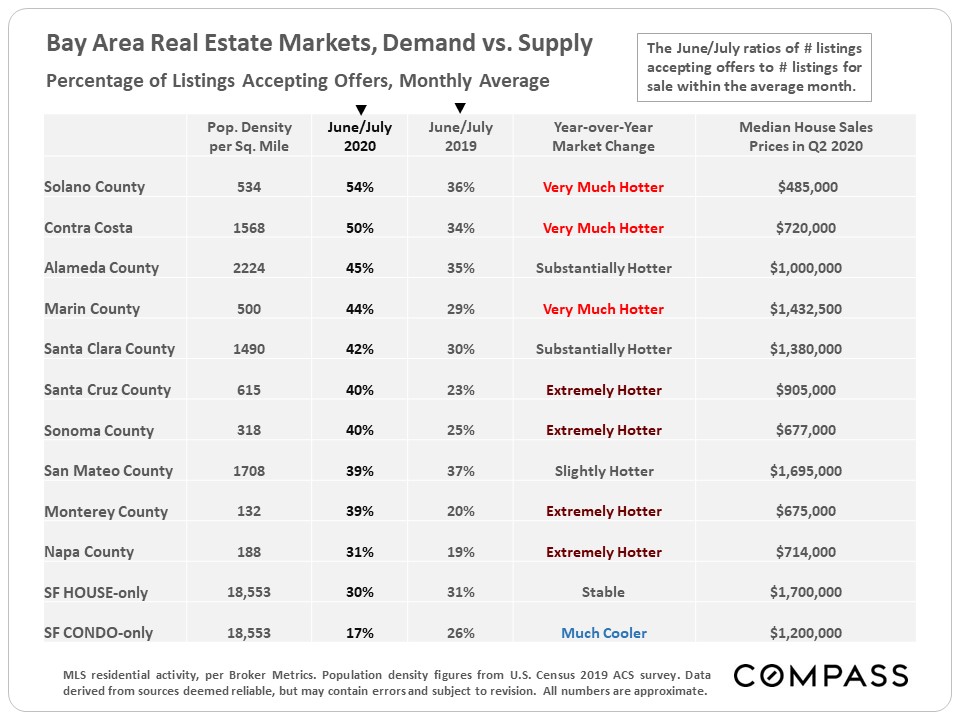
Bay Area Market Comparisons |
This table ranks each county by the percentage of active listings going into contract in June/July 2020 - a standard statistic of market heat - compares it to the same period of last year, and then rates the year-over-year change. Of the 3 most expensive counties, Marin ranks first in market heat and in year-over-year change. |
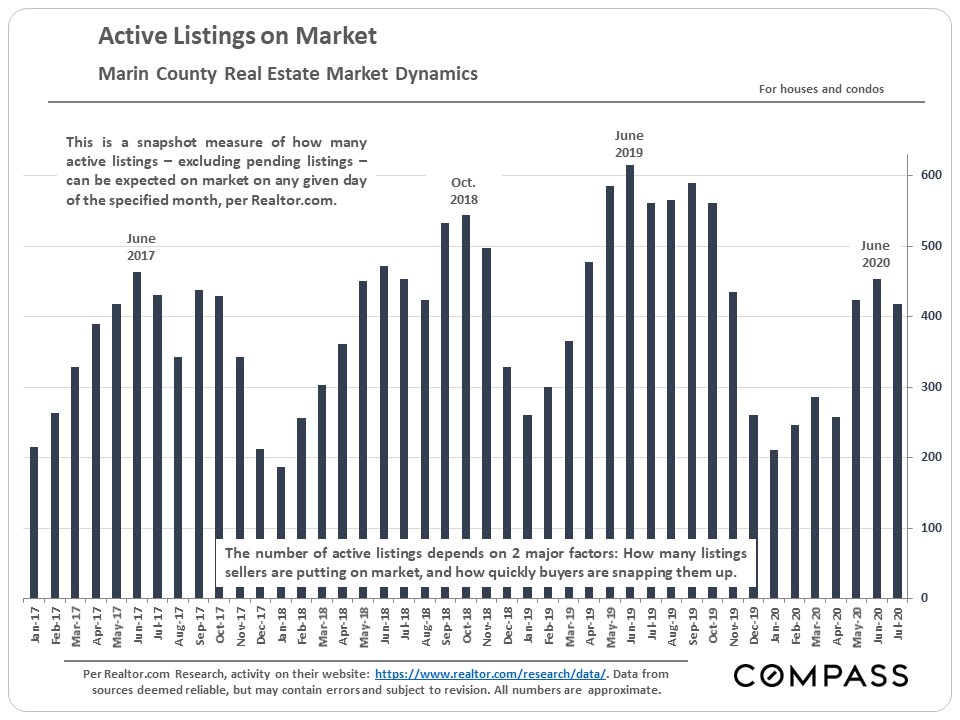
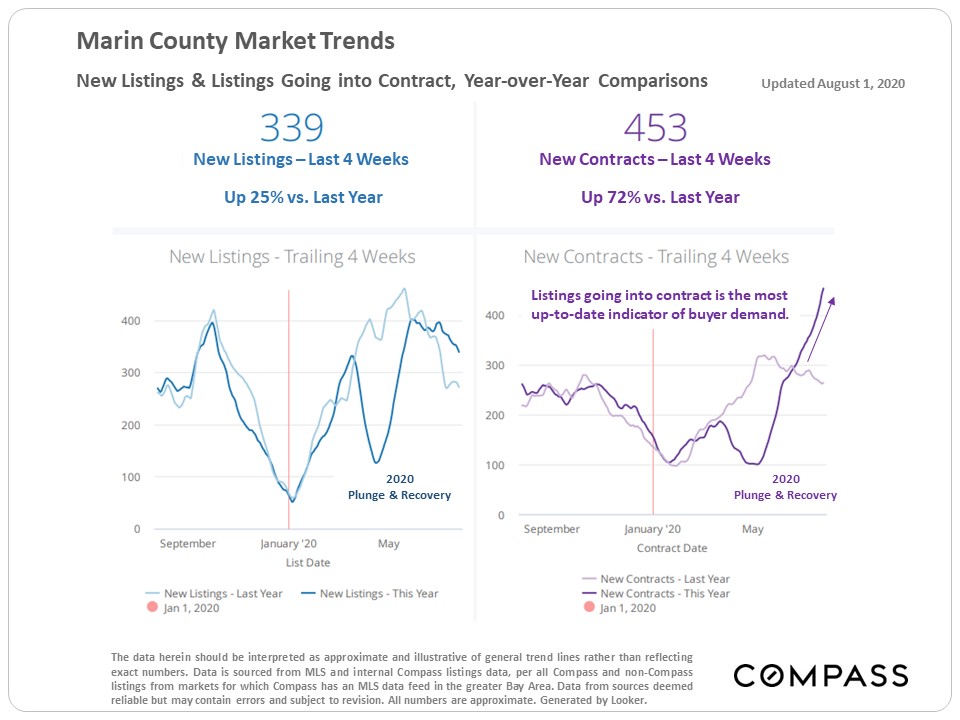
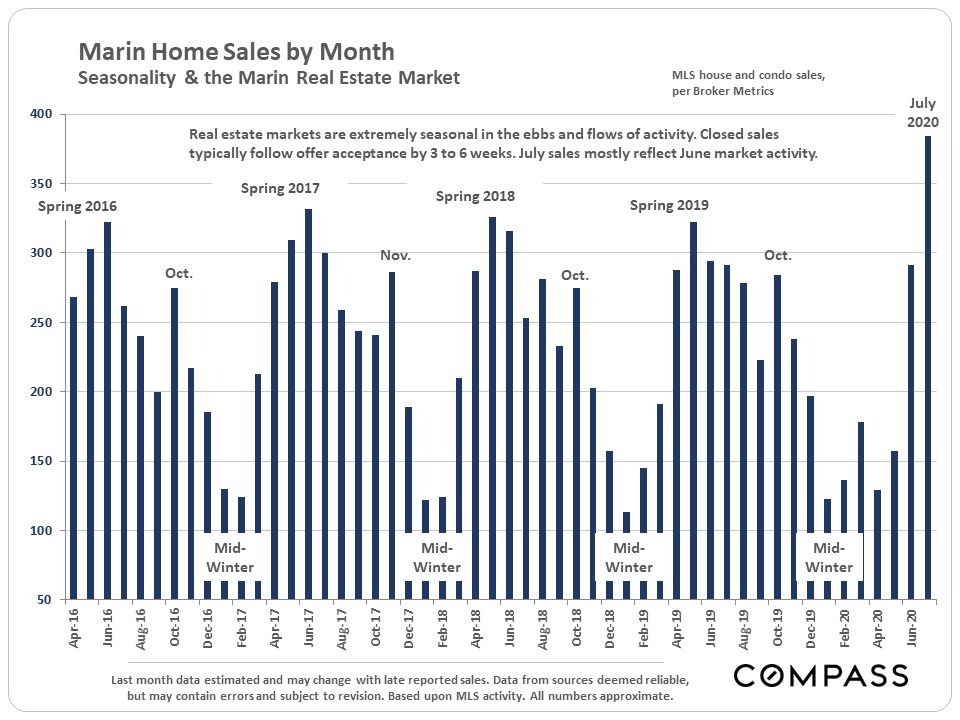
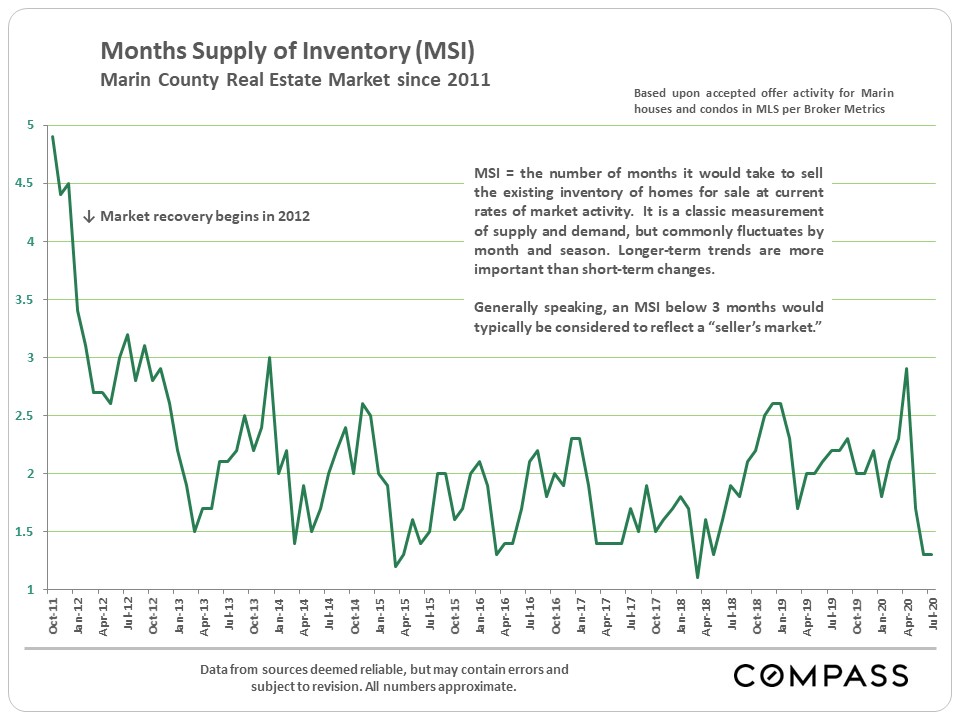
Supply & Demand Active listings, new listings coming on market, listings going into contract and sales volume trends |
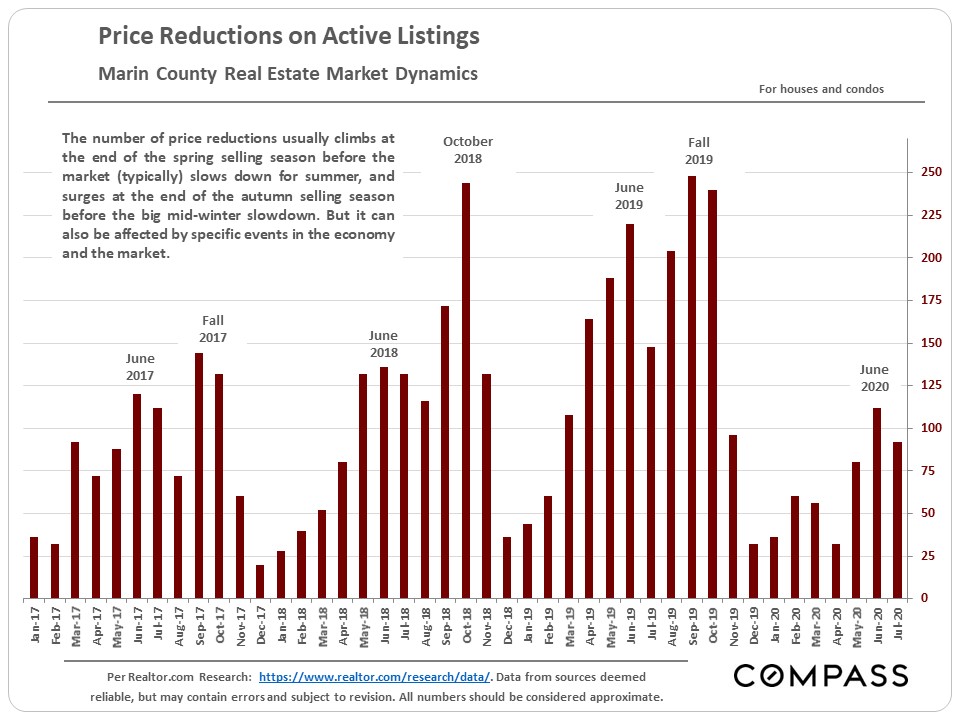
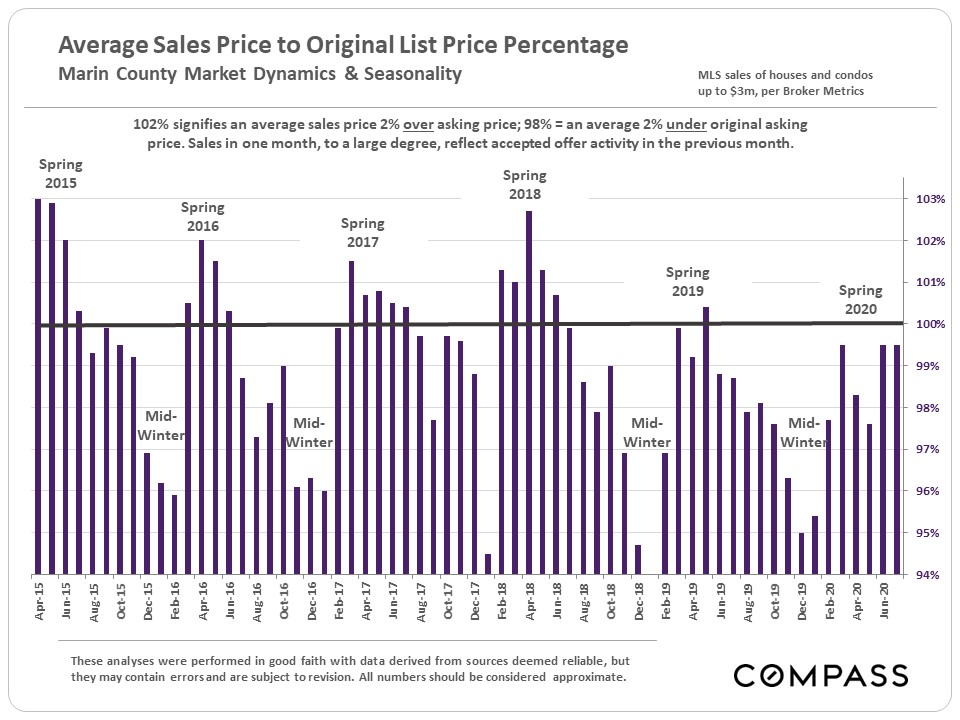
Selected Market Indicators |
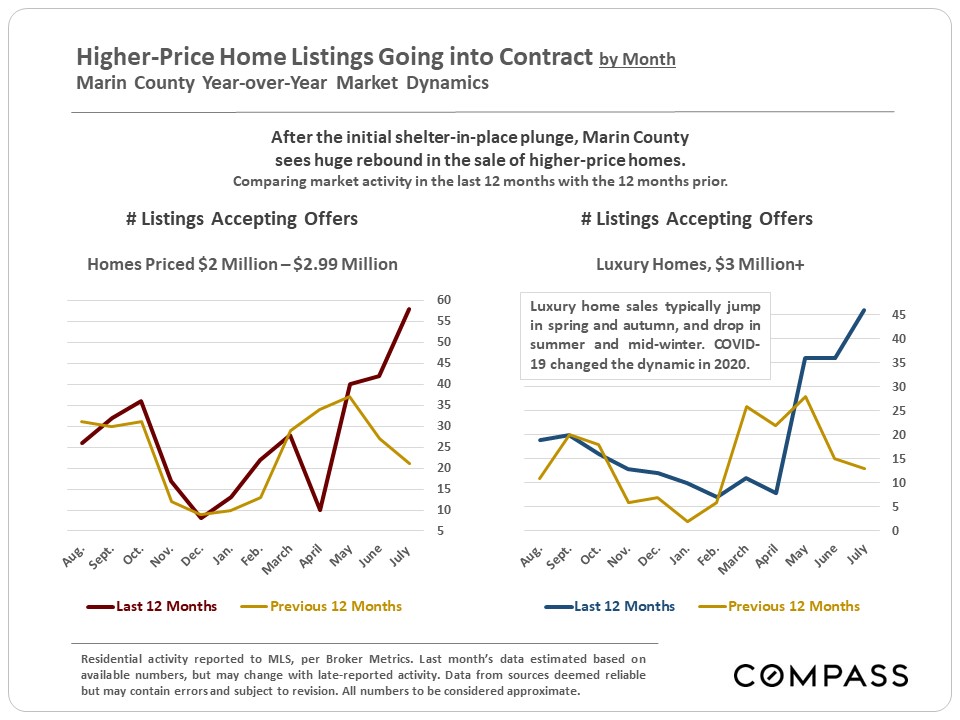
Higher-Price & Luxury Home Listings Accepting Offers |
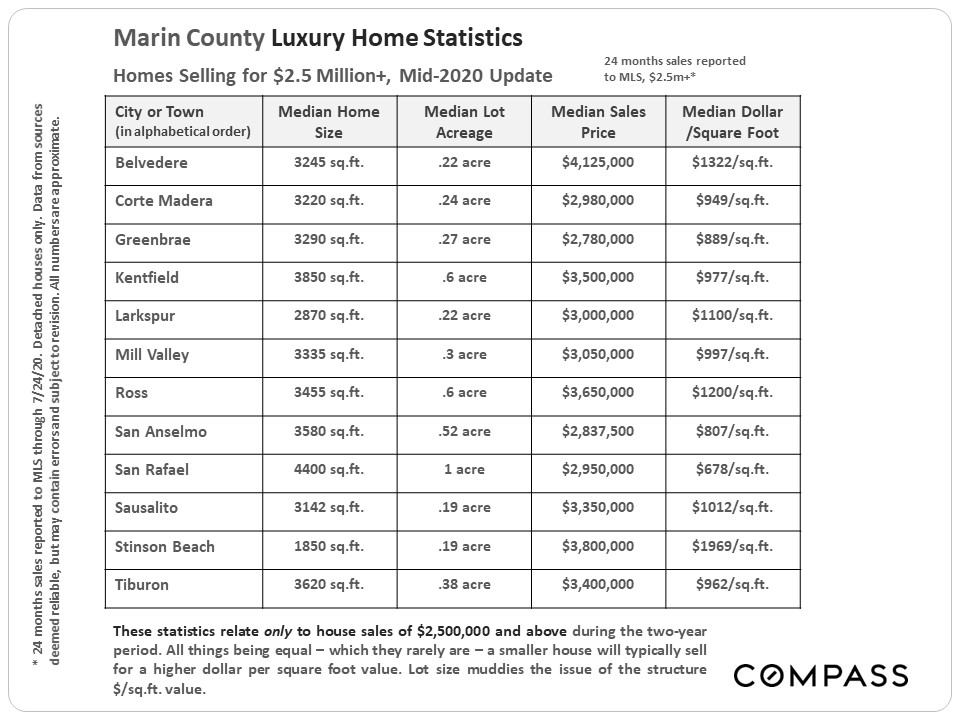
Selected Statistics on Homes Selling for $2.5 Million+ |
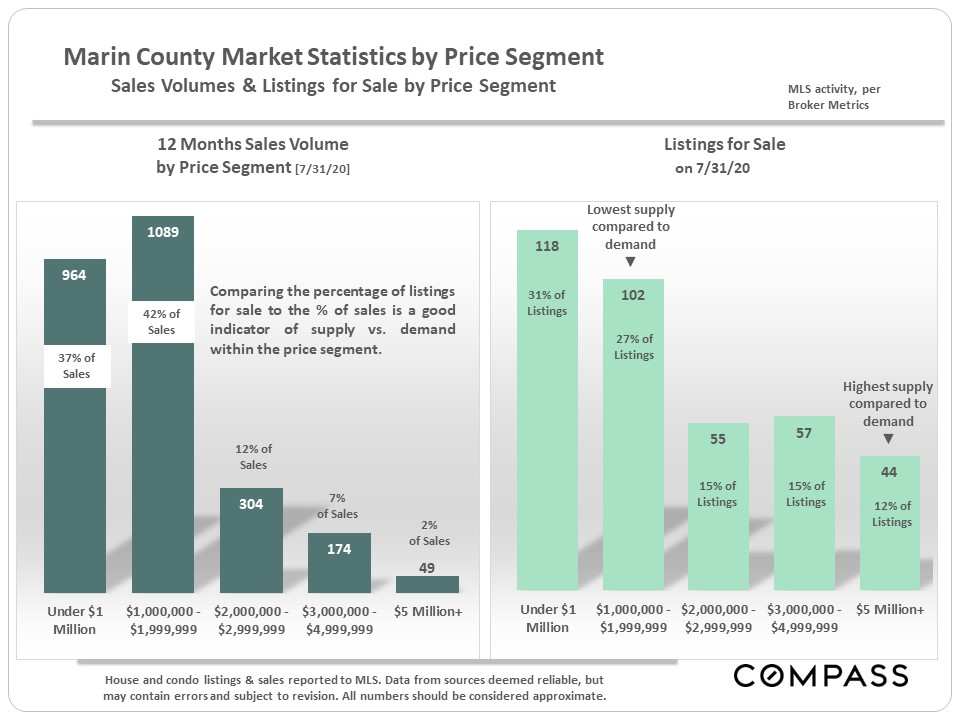
12 Months Sales & Listings for Sale, by Price Segment |
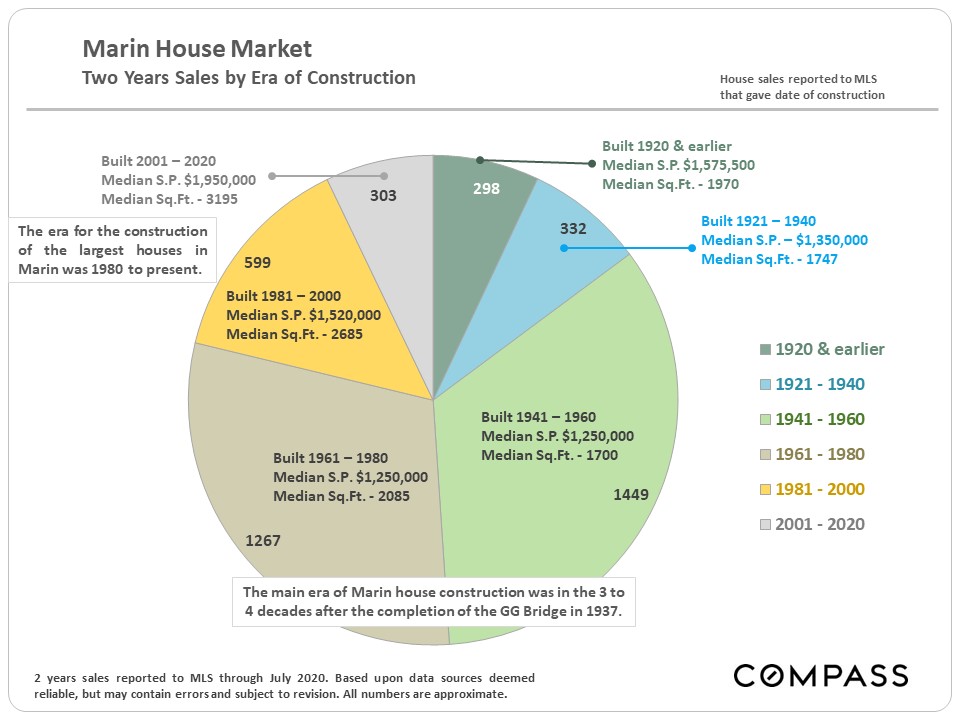
House Sales by Era of Construction |
|
© Compass 2020 ¦ All Rights Reserved by Compass ¦ Made in NYC
Compass is a real estate broker licensed by the State of California operating under
multiple entities. License Numbers 01991628, 1527235, 1527365, 1356742, 1443761, 1997075,
1935359, 1961027, 1842987, 1869607, 1866771, 1527205, 1079009, 1272467. All material presented
herein is intended for informational purposes only and is compiled from sources deemed reliable
but has not been verified. Changes in price, condition, sale or withdrawal may be made without
notice. No statement is made as to accuracy of any description. All measurements and square
footage are approximate. Equal Housing Opportunity.
|
|
|